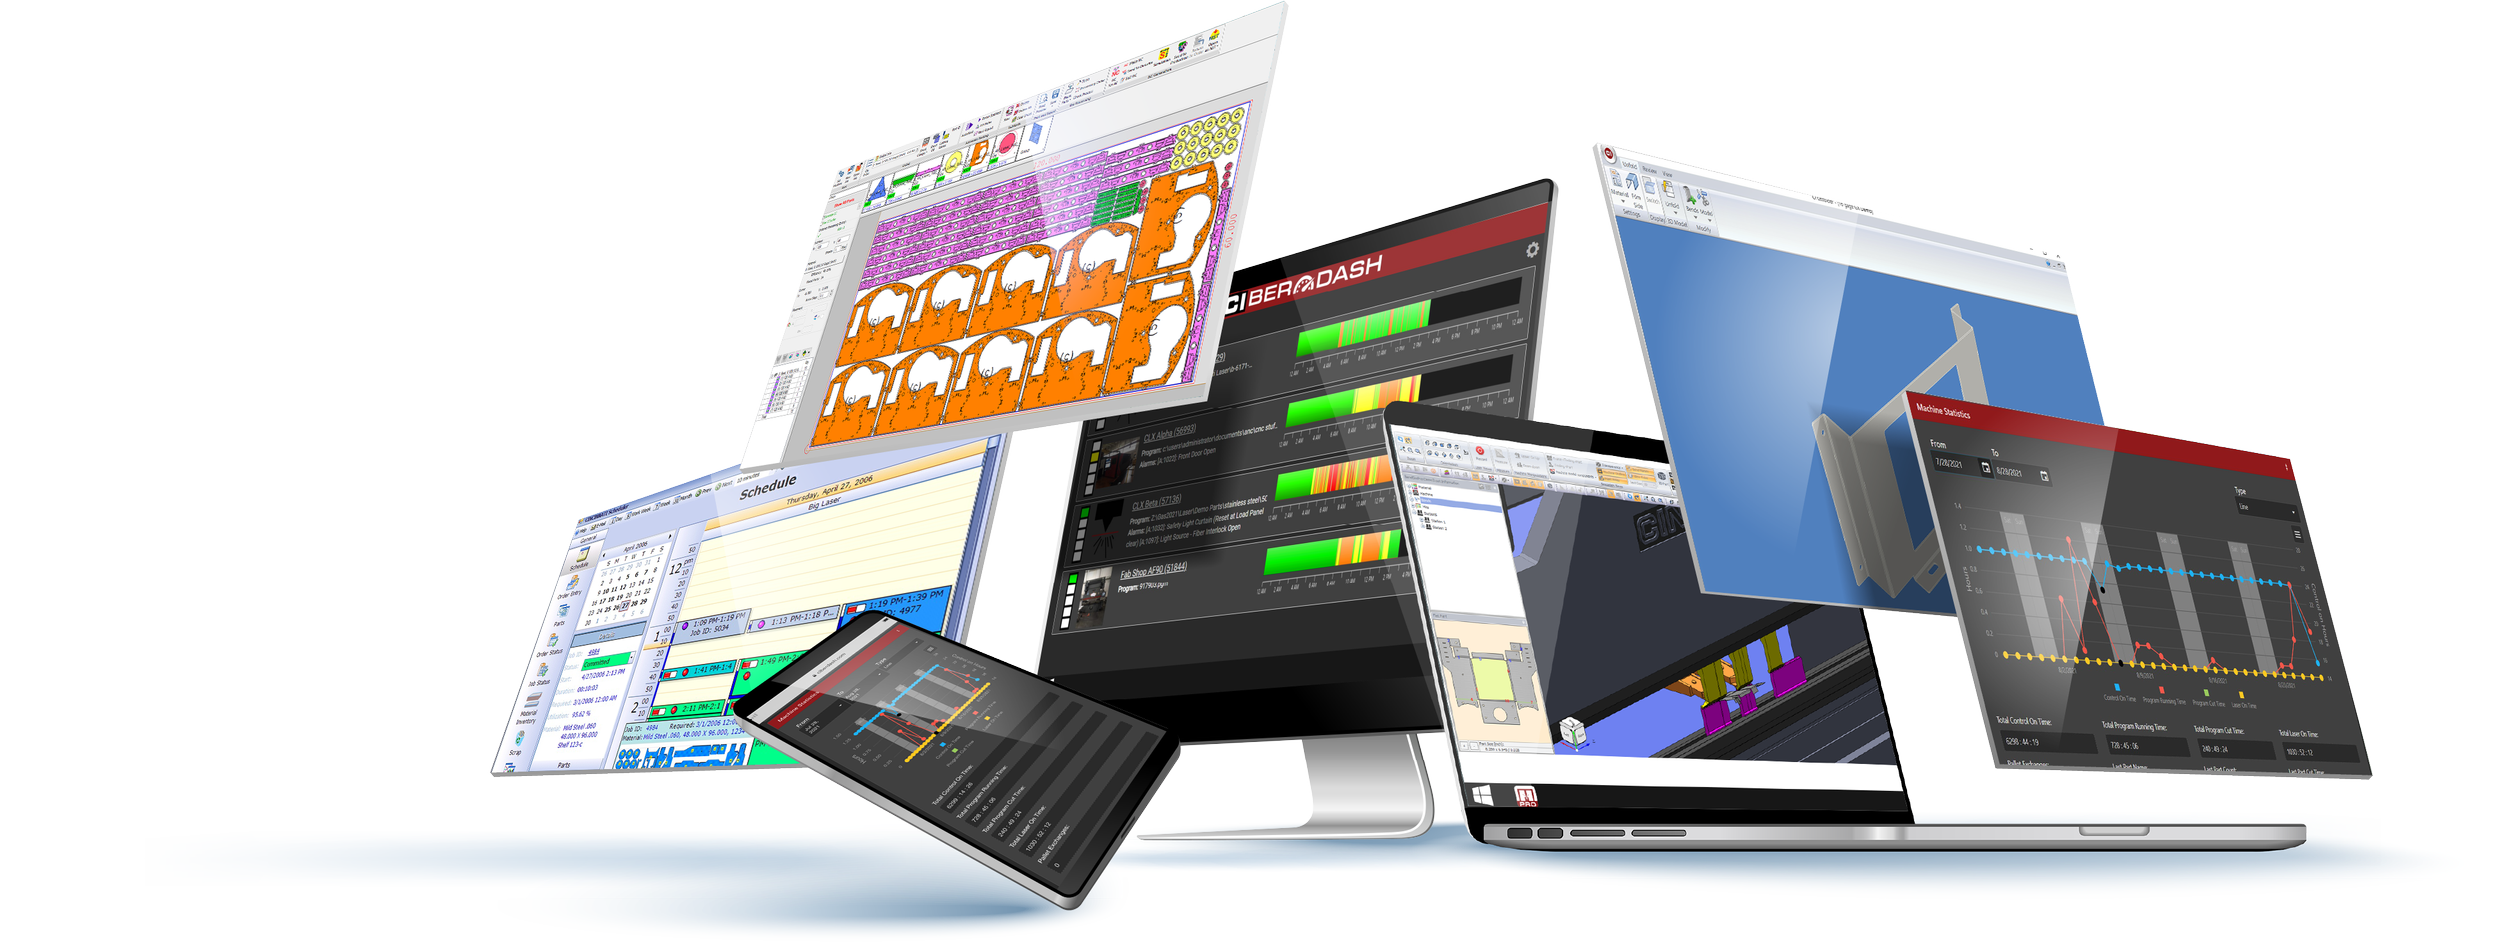
CI Link OPC UA: Secure, standardized machine data ready for any system.
How OPC UA Enables Third-Party Dashboard Connectivity
-
Machine Data Exposure
Systems export real-time data (status, production counts, errors, etc.) via an OPC UA server endpoint (e.g., opc.tcp://…:4840). Data is organized into a structured “address space” of variables called nodes.
-
Standardized Protocol
Being platform-agnostic and vendor-neutral, OPC UA allows dashboards like Grafana, Ignition, or Wonderware to connect without custom code. It manages discovery, secure encryption/authentication, real-time subscriptions, and data reading/writing.
-
Third-Party Dashboard as the Client
Once the server is running, users configure the dashboard’s client with the server URL, authenticate, browse available nodes, and map values to widgets like charts and gauges.
Why This Approach is Useful
-
Supported by most industrial visualization tools.
-
Built-in encryption and authentication.
-
Supports both live status and historical trends.
-
Add new data points without rewriting code.
Typical Integration Flow:
Enable OPC UA on your CI machine/software
Set the connection endpoint and security credentials
On the dashboard side: configure the client connection, browse data points, and bind them to visual elements to monitor production
Download the CI Connect Data Reporting Entities document
How It Fits With Other CI Tools
CI Connect is ideal for REST-based integrations with business tools like Excel, while CI Link OPC UA extends CI’s ecosystem into the industrial space—providing a secure, standards-based gateway for SCADA, MES, and analytics platforms that require OPC UA.


